Genesis Foods – Menu Comparison Demo
Stop Toggling Between Spreadsheets
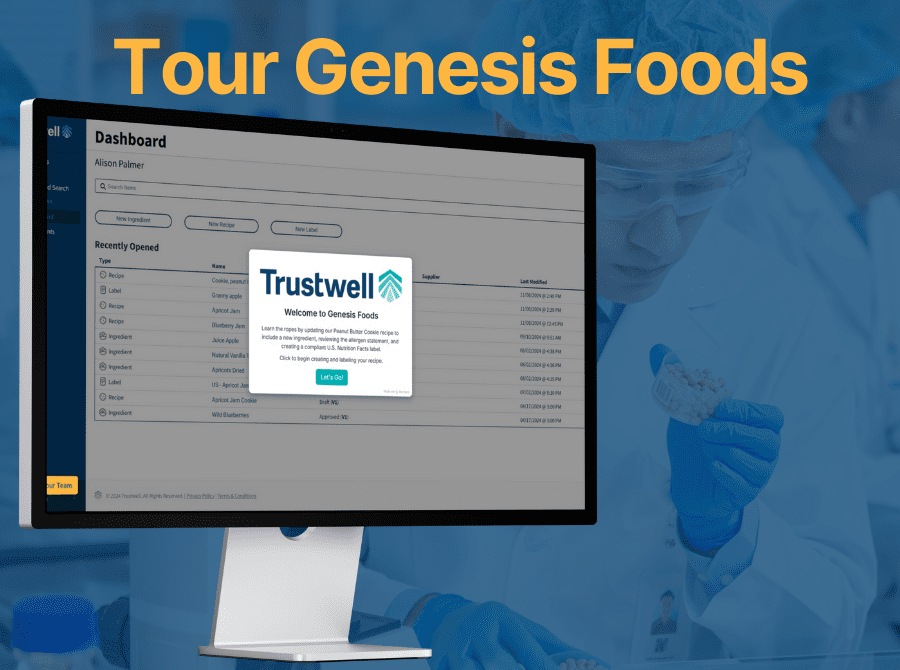
Start The Demo To See How Comparing Menus Are Straightforward In The Food Comparison Report
Manually comparing recipes for cost, nutrition, and compliance is slow and prone to error. Take this quick interactive tour of the Food Comparison Report and see how to audit your entire menu in a single view.
For Quick-Serve-Restaurants in the UK in particular, the tool helps met your regulatory requirements for meeting calorie and allergen labelling.
Request Your Bespoke Demo of Genesis Foods
From recipe development to nutrition analysis and label creation, see Genesis Foods and the Trustwell Connect Platform in action and learn how it can be customised to meet your unique needs.


Or, contact us today to learn more about how Trustwell can help you achieve seamless regulatory compliance, efficient supplier onboarding, and lasting success.
Genesis Foods FAQ’s – QSRs and the UK
How does the Food Comparison Report help with seasonal menu launches? The Food Comparison Report allows R&D teams to compare new recipe versions against existing core menu items side-by-side. You can analyze calorie counts, allergens, and cost-driving ingredients across multiple variations to ensure your new seasonal offering hits the right nutritional and margin targets before it hits the shops.
Can we compare the nutritional profiles of different supplier ingredients? Yes. You can pull in multiple versions of a Recipe (e.g., a brioche bun from two different suppliers) to see exactly how they impact the final recipe’s nutritional breakdown. This is essential for maintaining brand consistency when diversifying your supply chain.
How can we share these reports with our marketing or operations teams? The Food Comparison Report is built for collaboration. You can create and manage reports that are accessible across your organization. Once your analysis is complete, you can export the data directly into CSV or Excel formats to share with stakeholders who don’t have direct access to Genesis Foods.
Can we group menu items by category (e.g., Sides, Mains, Drinks)? Absolutely. The report allows you to add and organize food items into custom categories. This makes it much easier to manage high-volume menus and compare specific product lines (like comparing all “Plant-Based” options) in one view.
Does the Food Comparison Report support UK-specific labelling and rounding rules? Yes. When setting up your report, you can apply authority-specific label rounding. This ensures that the nutritional data displayed for your UK menu items complies with local UK/EU regulations, which differ from US FDA standards (e.g., using kJ in addition to kcal).
How does this tool assist with the UK’s Mandatory Calorie Labelling requirements? For QSRs with more than 250 employees in the UK, calorie labelling on menus is a legal requirement. The Food Comparison Report allows you to quickly audit your entire menu to ensure calorie counts are accurate across all portions and variations, helping you stay compliant with the “Calorie Labelling in Out-of-Home Sector” regulations.
Can the report help identify allergens for UK “Natasha’s Law” compliance? By using the Food Comparison Report to compare recipes and ingredient versions, QA professionals can easily spot the presence of any of the 14 major allergens required by UK law. This provides a clear audit trail for PPDS (Prepacked for Direct Sale) items, ensuring that the information on your labels or digital kiosks is 100% accurate.
Is the data exportable for use in UK third-party delivery apps (e.g., Deliveroo, Just Eat)?
Yes. Because you can export the comparison data to Excel or CSV, you can easily format your nutritional and allergen data to meet the upload requirements of various UK delivery platforms, ensuring consistency between your in-store menus and your digital storefronts.
Why is the Food Comparison Report important for QSR brands?
QSRs operate at scale, often with multiple suppliers and frequent menu updates. The Food Comparison Report helps ensure nutritional data is accurate, ingredient lists are consistent and menu items match brand and regulatory standards. This reduces risk and protects brand integrity across all sites.
Other UK Food Formulation Resources


Tour More Food Software Solutions
See Genesis Foods and the Trustwell Connect Platform in action and learn how it can be customised to meet your unique needs.